I’m using Ubuntu running in a virtual machine. This could also be done on another Pi 3 or 4, I wouldn’t recommend doing this on the AutoPi itself. I’m using the 4G AutoPi Telematics Unit, Im not sure how well the telegraf agent would work on a wifi only device. I apologise in advance if anyone finds this poorly written.
I am using the Grafana-kiosk on another Pi connected to my virtual machine to display the dashboard.
On the Virtual Machine or secondary Pi
- Install InfluxDB 1.8 and above (Some issues with previous versions)
Set influx to TSI1 to prevent high memory issues later on (6-12 months later if you don’t have enough memory (RAM))
Run
echo “deb https://repos.influxdata.com/ubuntu focal stable” | sudo tee /etc/apt/sources.list.d/influxdb.list
sudo curl -sL https://repos.influxdata.com/influxdb.key | sudo apt-key add -
sudo apt-get update && sudo apt-get install influxdb
Then modify the influxdb config
sudo nano /etc/influxdb/influxdb.conf
Find and replace
index-version = “inmem”
with
index-version = “tsi1”
If you are going to open ports on your firewall for the AutoPi to record the metrics, I strongly suggest enabling Authentication on InfluxDB. A user and password must be set, and then enforce it in influxdb.conf
Launch Influx
influx
Then create the user with
CREATE USER admin WITH PASSWORD choosepasswordhere WITH ALL PRIVILEGES
- Install Grafana
Install some plugins
Gauge
sudo grafana-cli plugins install briangann-gauge-panel
Worldmap
sudo grafana-cli plugins install grafana-worldmap-panel
Or the pr0ps-trackmap
sudo grafana-cli plugins install pr0ps-trackmap-panel
Influx should now be running on port 8086, and Grafana on port 3000
I have a Cloudflare Argo Tunnel connecting my influxdb and Grafana to the outside world, that way Cloudflare can offer some protection without having to open any ports, but its about $5 each month. using a domain name for the influxdb server would be best (dyndns, Cloudflare etc.)
On the AutoPi
Enable the mosquito server via the autopi cloud under MQTT
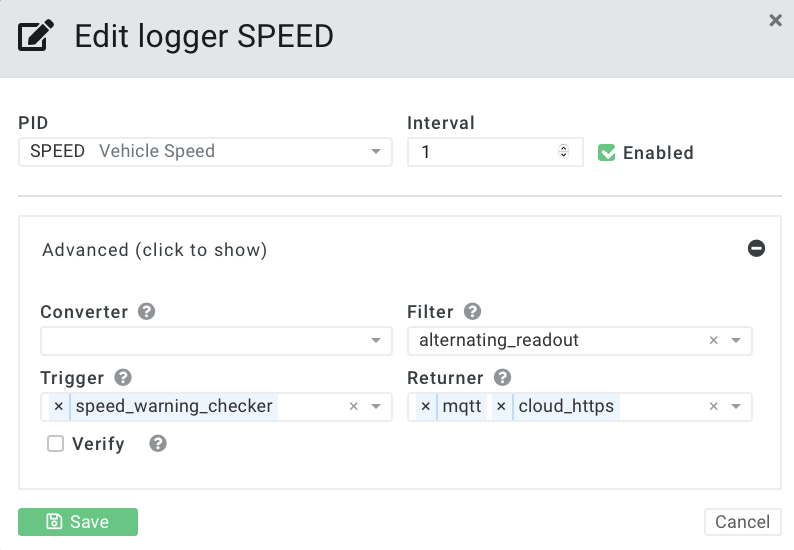
Enable the MQTT returner tick box
Enable MQTT as an additional returner for each of the loggers under car explorer
Enable SSH via the cloud, connect directly to it via SSH then;
Install telegraf
curl -sL https://repos.influxdata.com/influxdb.key | sudo apt-key add -
echo “deb https://repos.influxdata.com/debian buster stable” | sudo tee /etc/apt/sources.list.d/influxdb.list
sudo apt-get update
sudo apt-get install telegraf
Modify the telegraf configuration
sudo nano /etc/telegraf/telegraf.conf
Configure the telegraf agent, I have mine set to:
interval=“10s”
metric_batch_size = 100000
metric_buffer_limit = 100000
set the output plugin to use influxdb
I have mine set to:
[[outputs.influxdb]]
urls = [“https://influxdb.mylocaldomainname.com.au”]
database = “autopi”
username = “admin”
password = “newlycreatedpassword”
configure telegraf to connect to the autopi mosquito service (this part in the Telegraf.conf is almost at the bottom, it will take some time to find it (quite some time when using nano…)
I have mine set to subscribe to all topics
[[inputs.mqtt_consumer]]
servers = [“tcp://localhost:1883”]
topics = [
“#”,
]
data_format = “json”
restart the telegraf service
sudo service telegraf restart
Configure datasources in Grafana
you use the Grafana explorer and check your metrics are being posted to influx
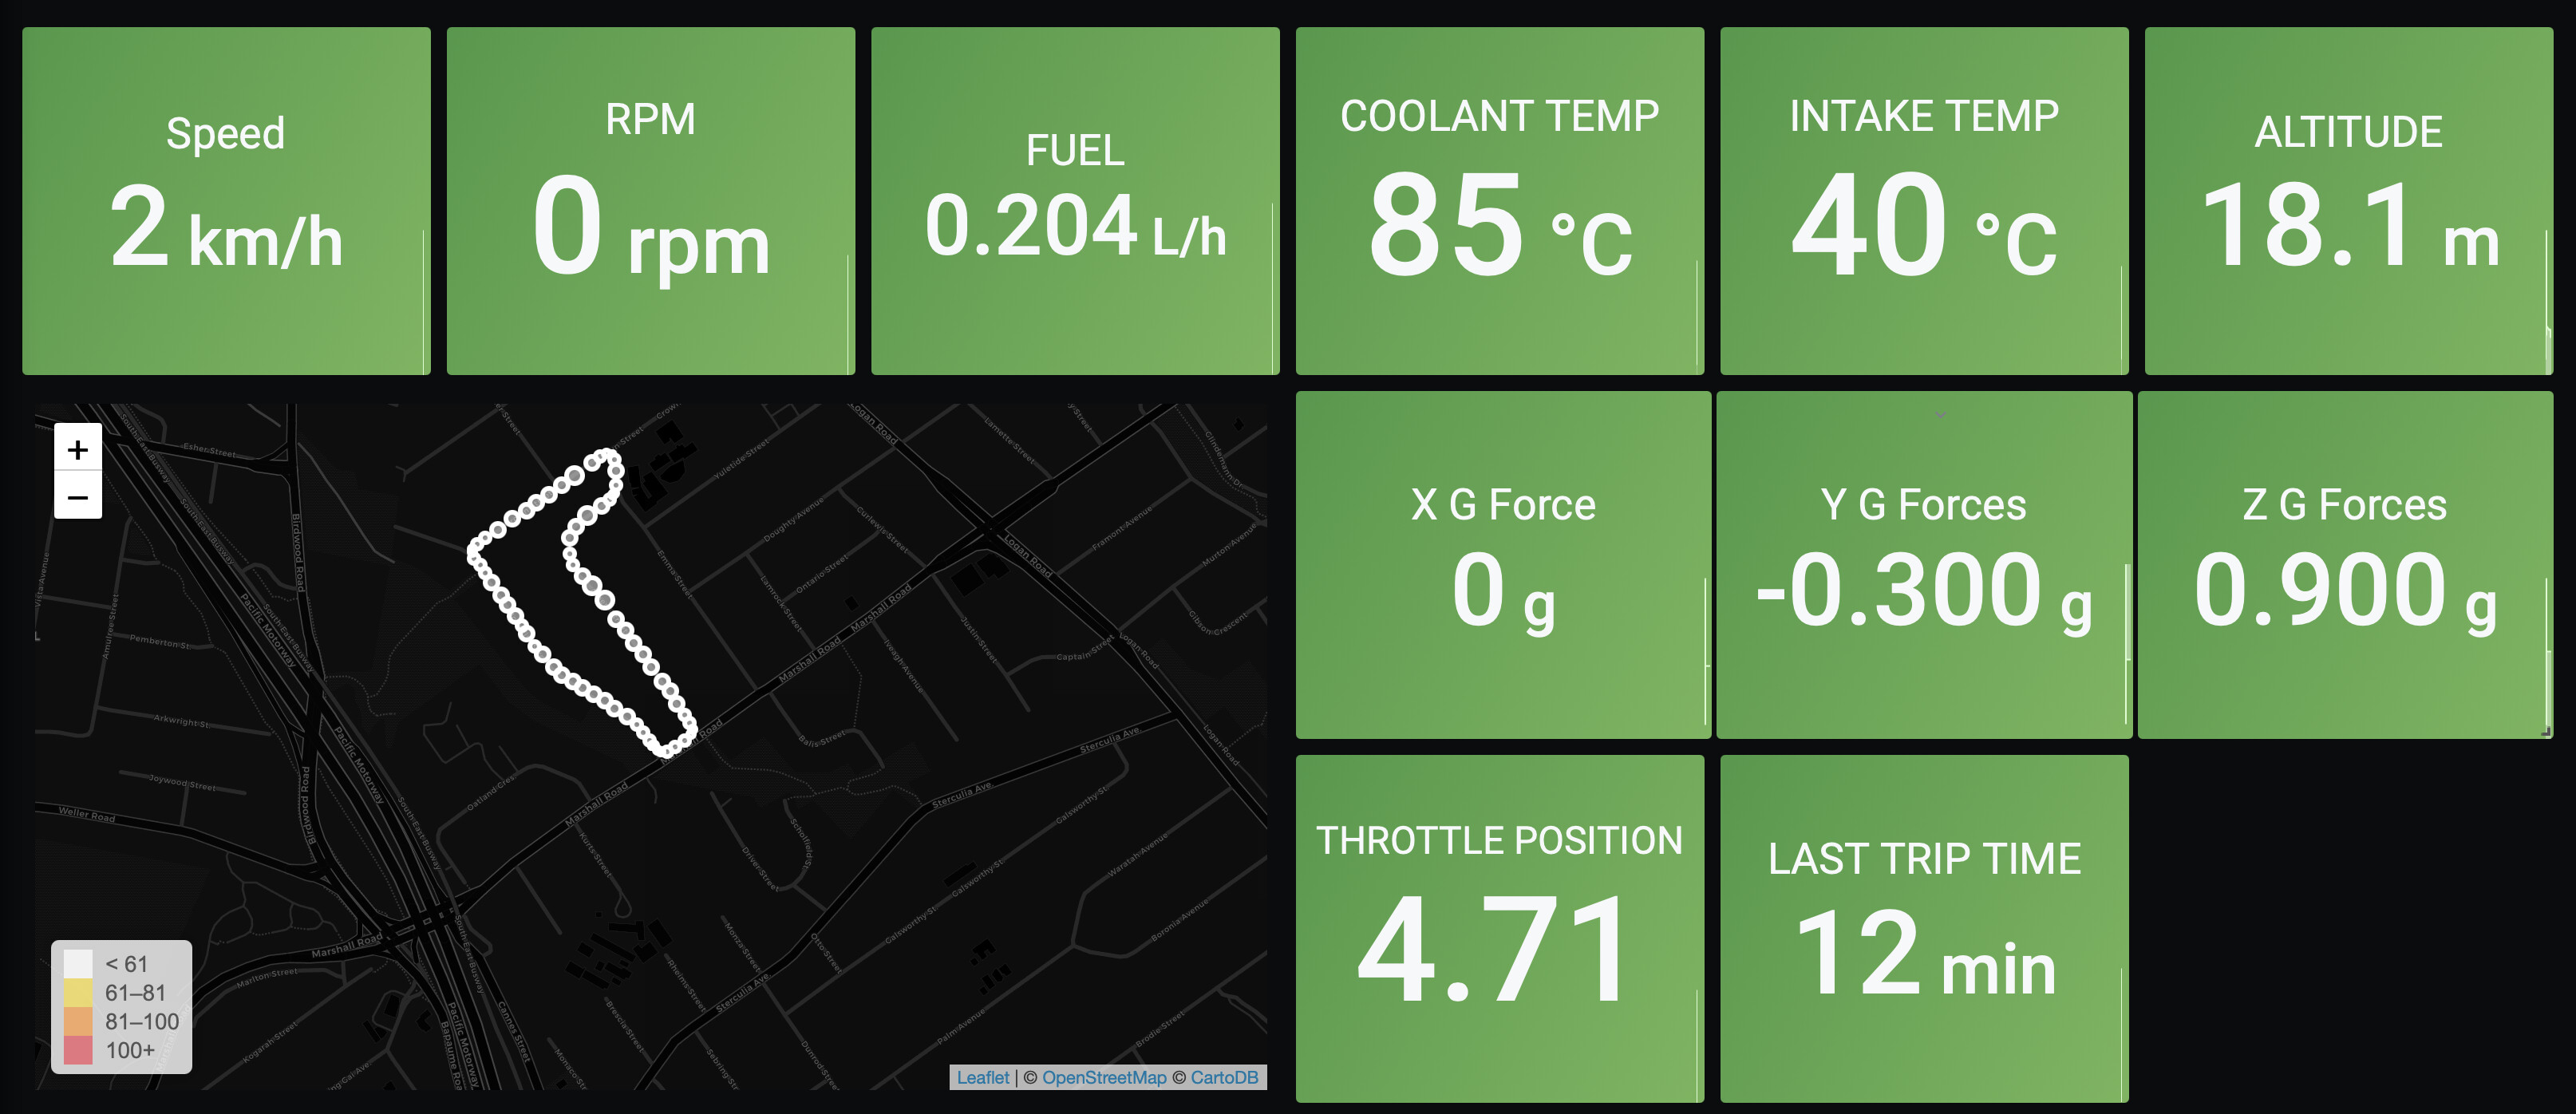
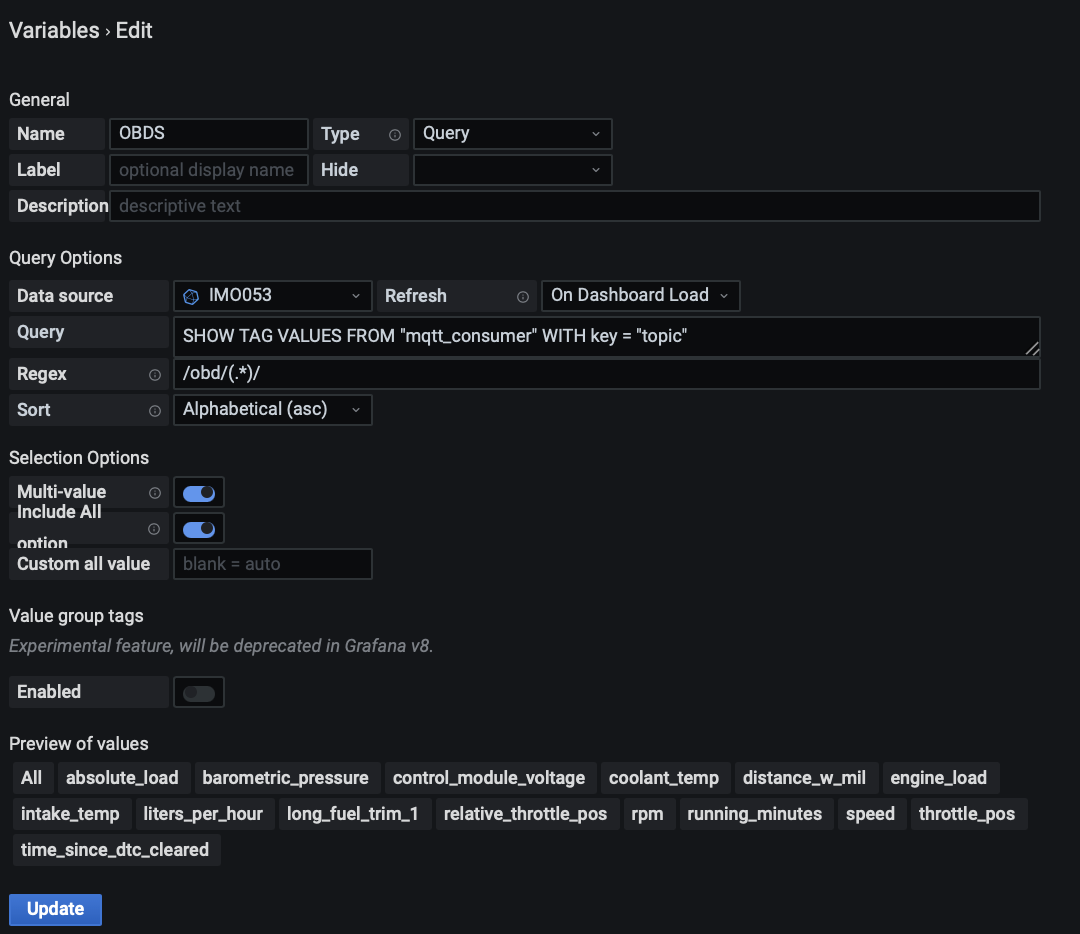
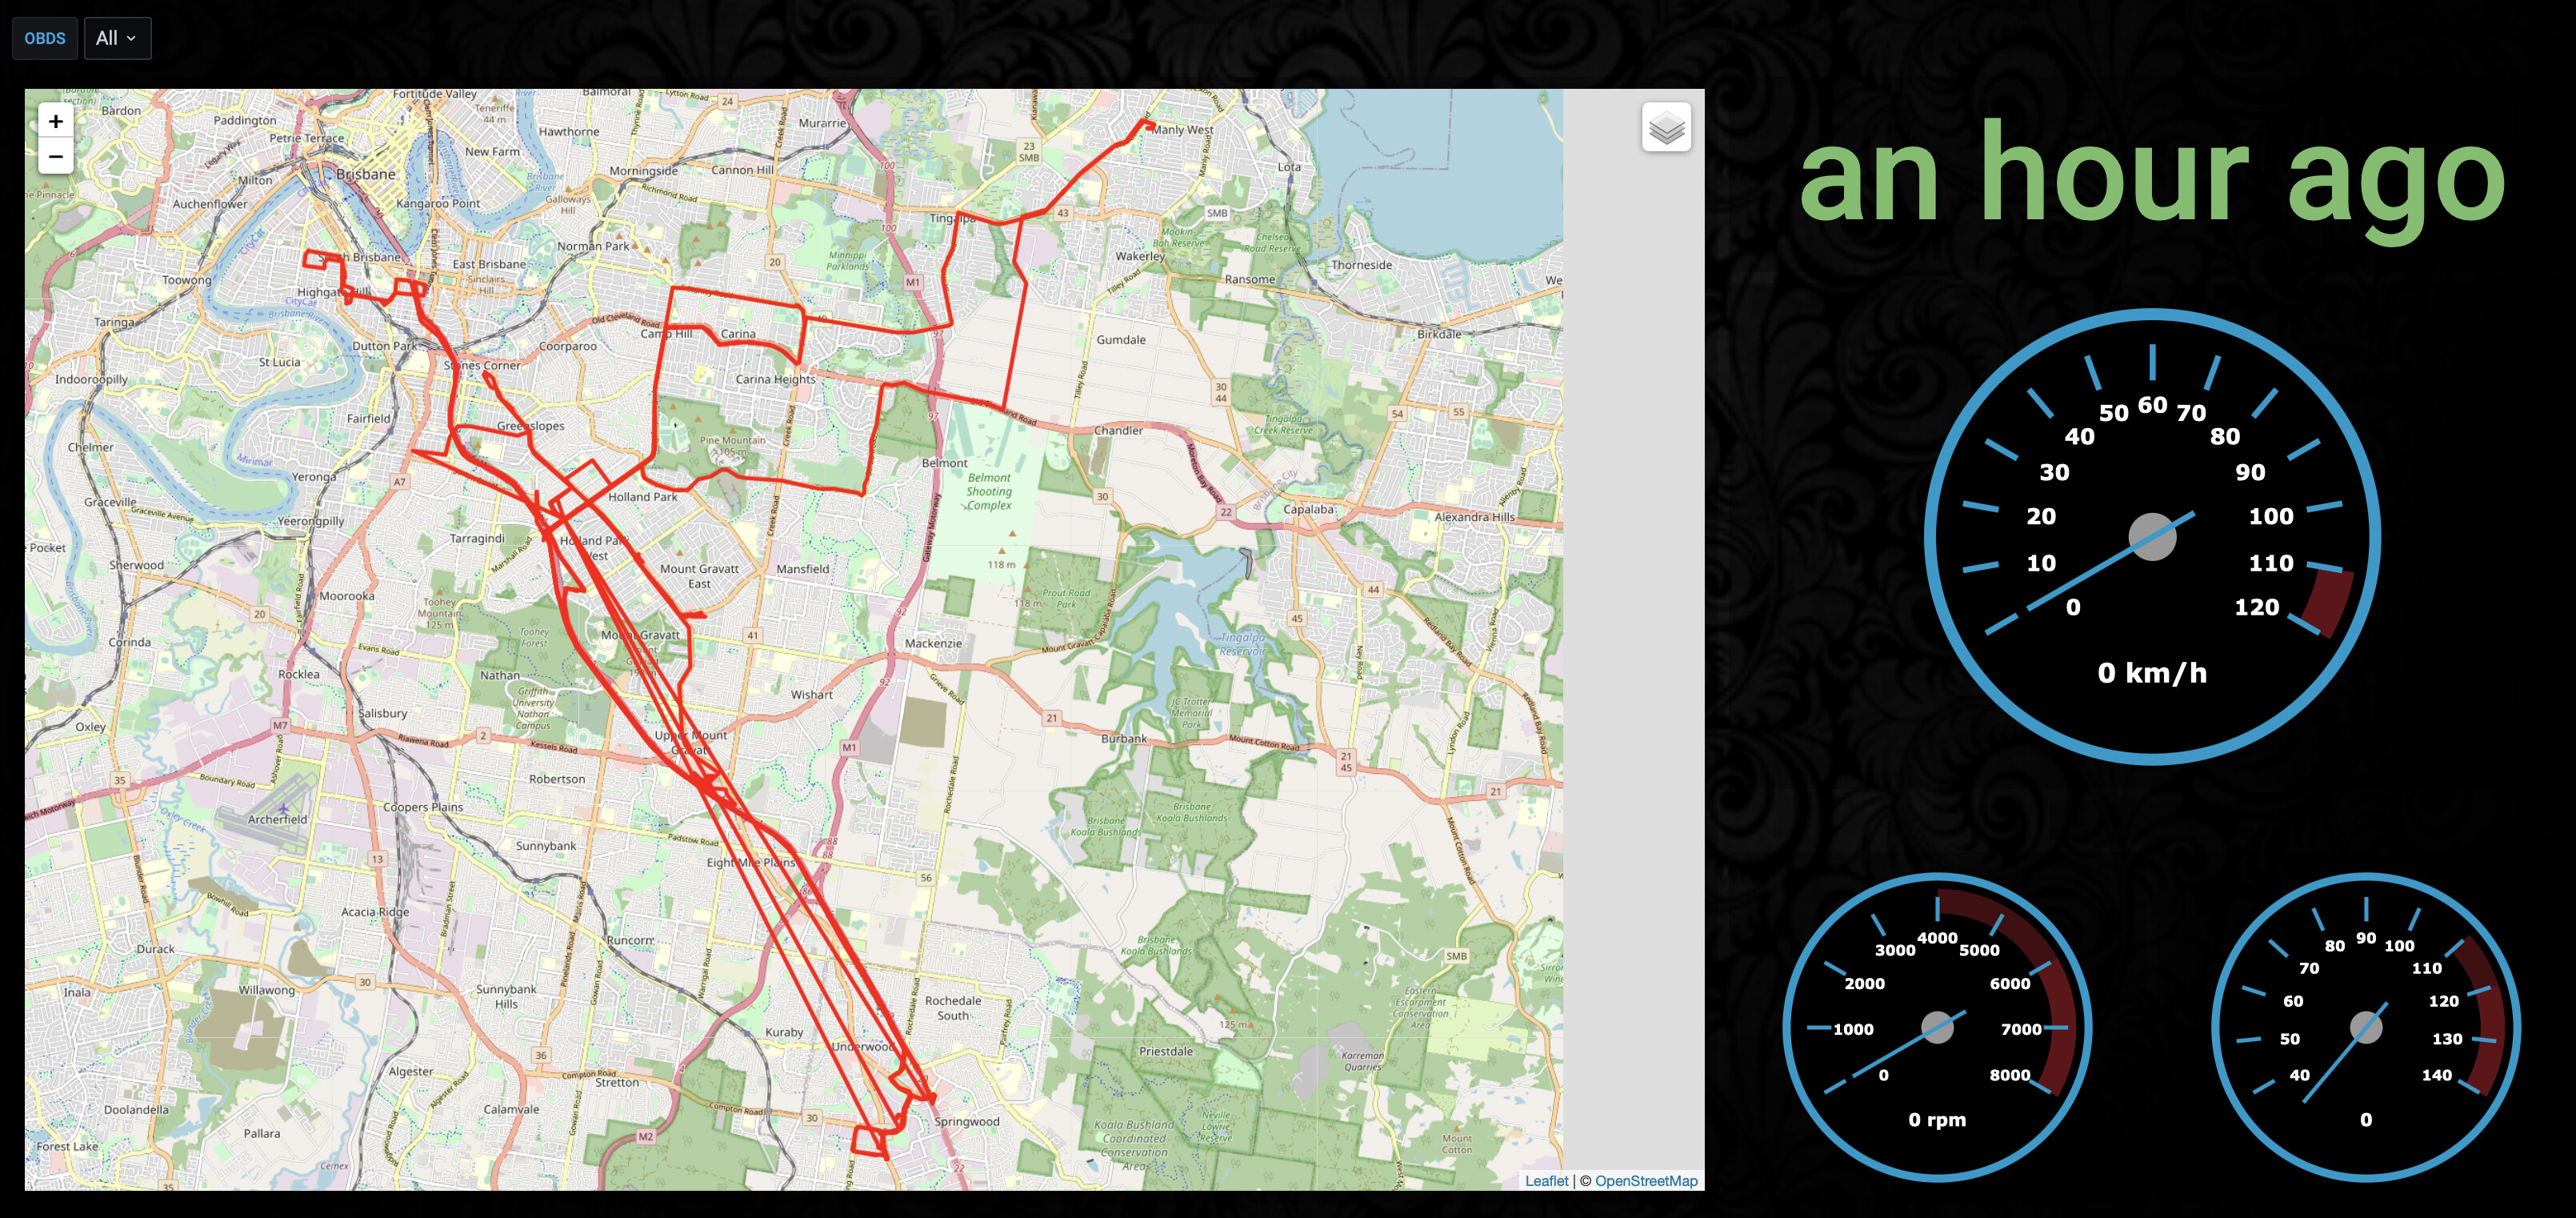
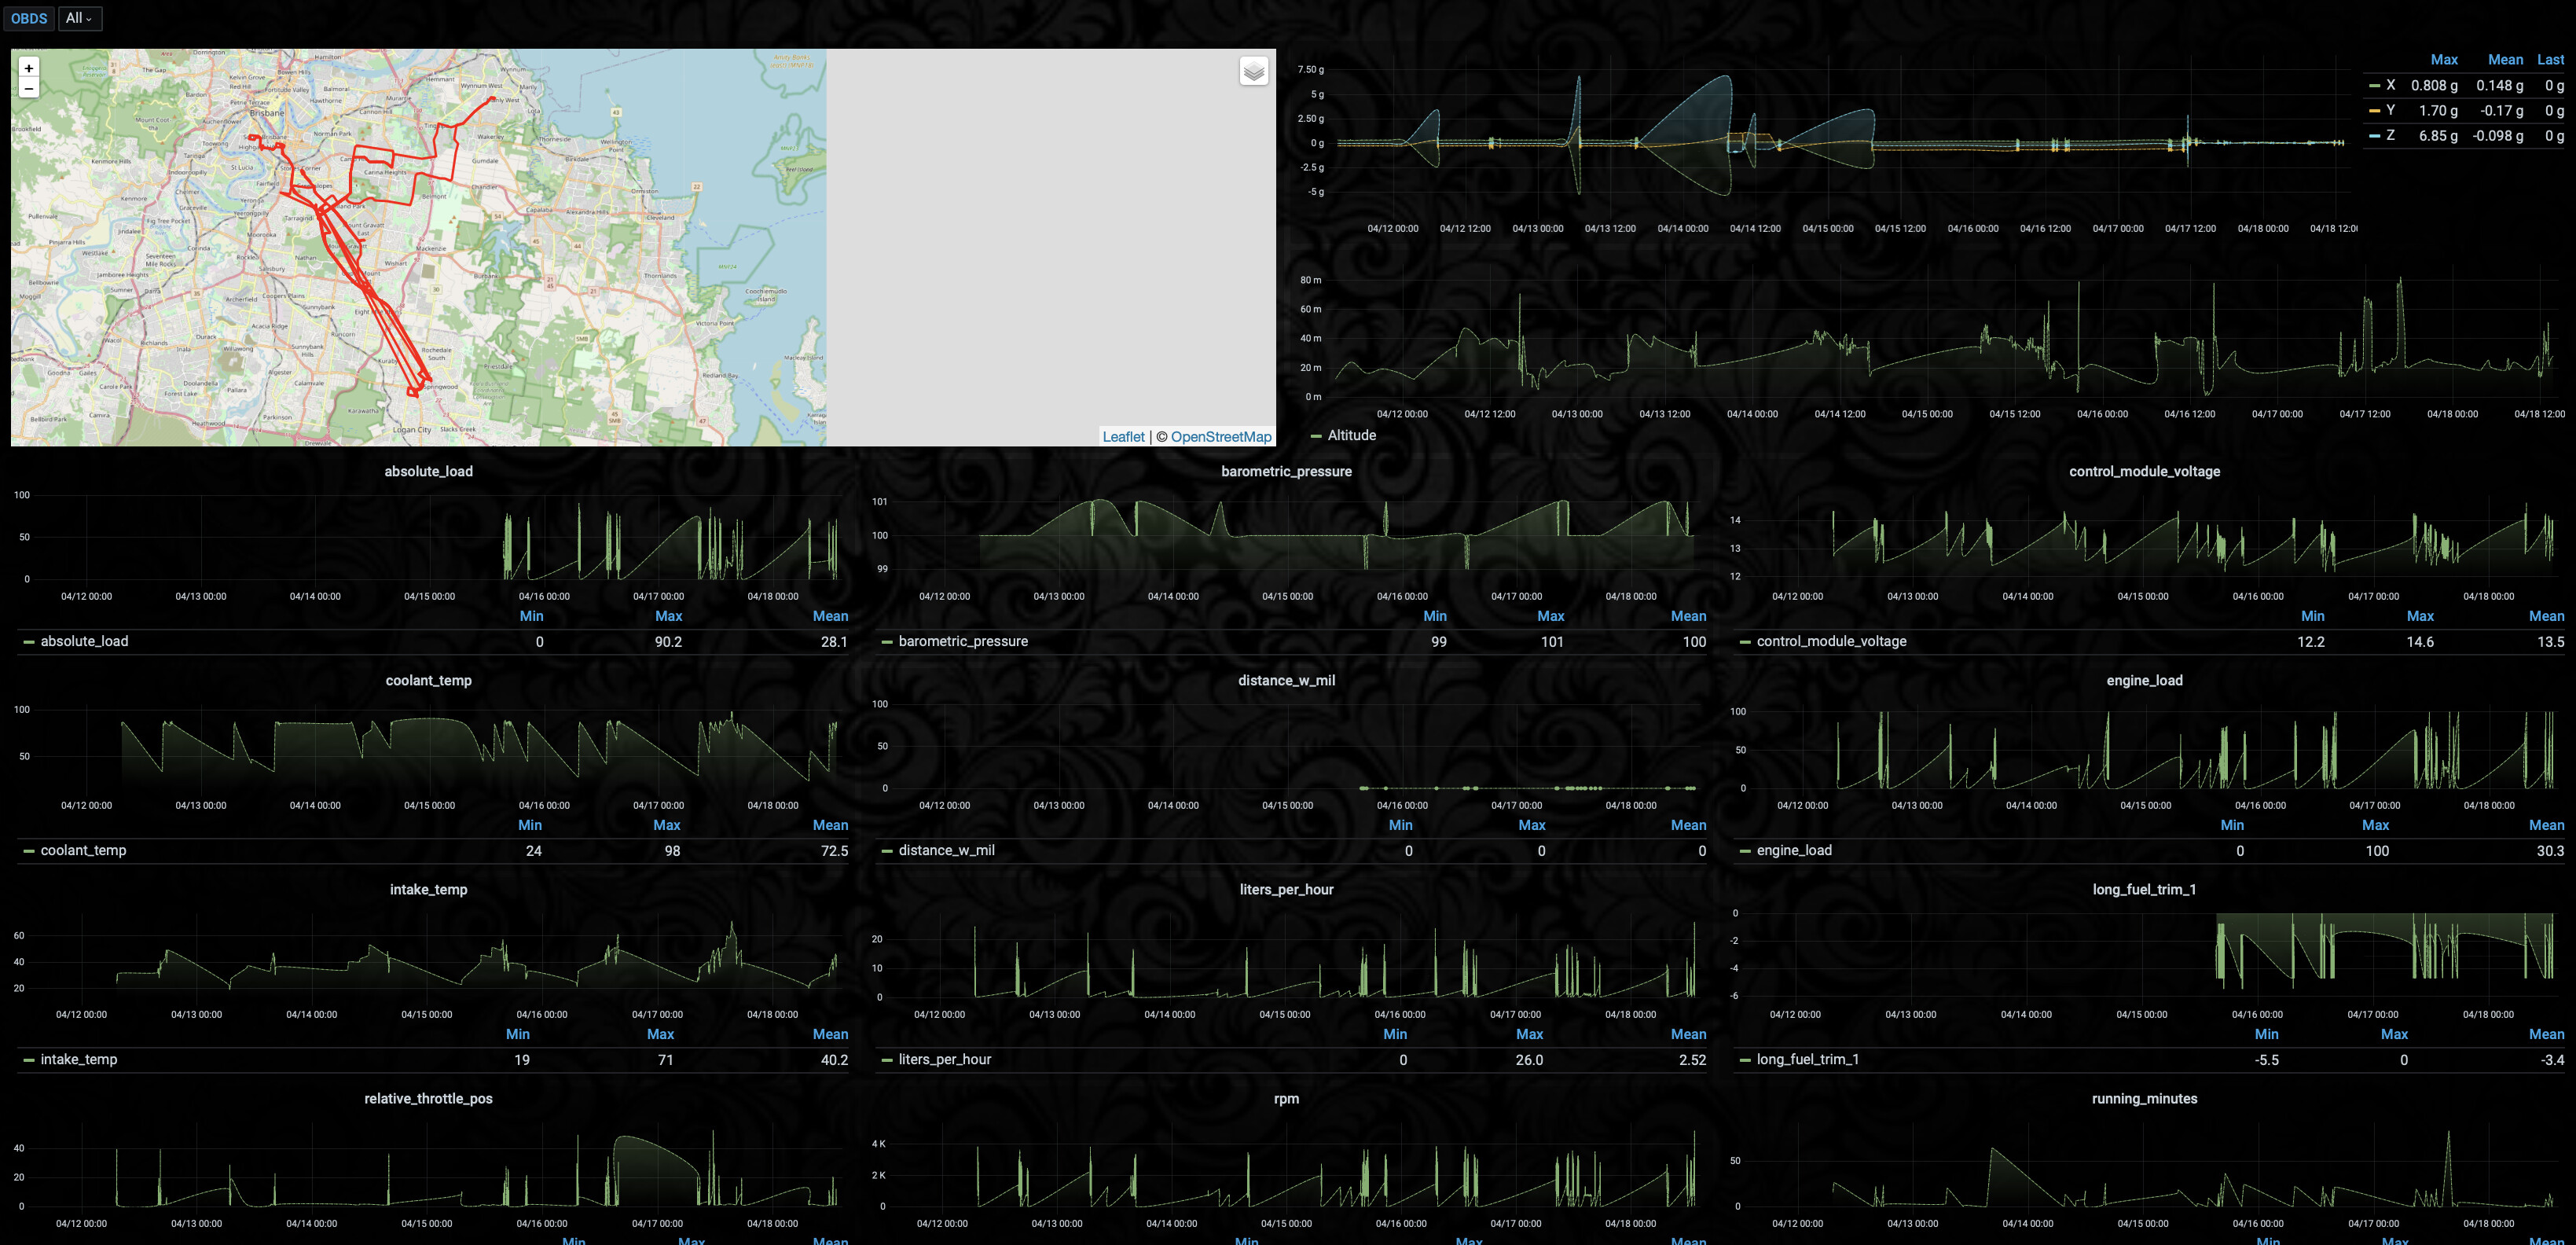
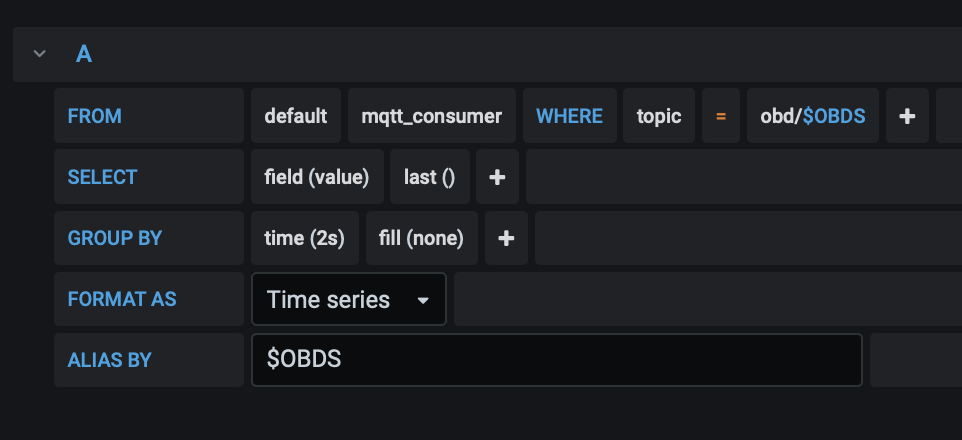
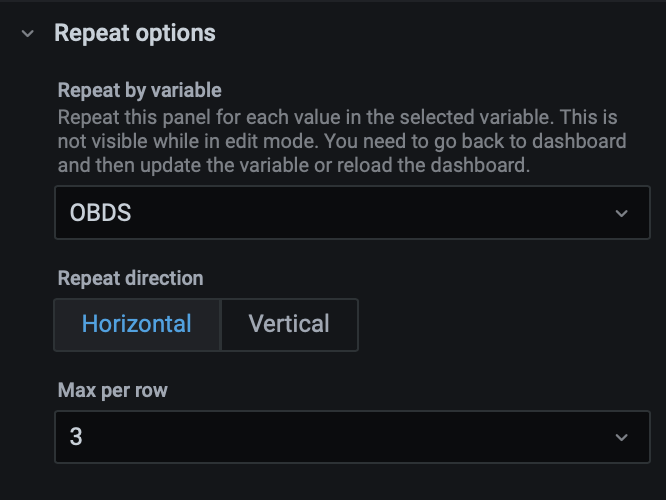
Create a dashboard, I have set variables for OBD metrics, that way any new loggers created in the cloud will automatically be shown in the dashboard. I have a dashboard for analysis and another simple one for show (might set this up as an in car dashboard later)
simple dash
analysis dash
using the variables within the Grafana queries
using the track map to draw lines on the map, I have mine limited to only a few of the last coordinates